HiSET Science Study Guide: Essential Scientific Skills
The HiSET science test covers a lot of information, some of which you may have forgotten since your time in high school biology, chemistry, or physics. However, like other parts of the HiSET, the HiSET science test is just as much a reading comprehension test as a science test. This means your success on test day depends on knowing what a question is asking as well as the scientific knowledge it assesses.
The following scientific skills are those you should be ready to apply on test day. After reviewing these skills, we’ll look at a practice question, evaluate which skills you need to answer the question, and find the right answer.
Using the Scientific Method
The scientific method is the foundation for all modern science. Developed in the 17th century, it is a process scientists follow in their work.
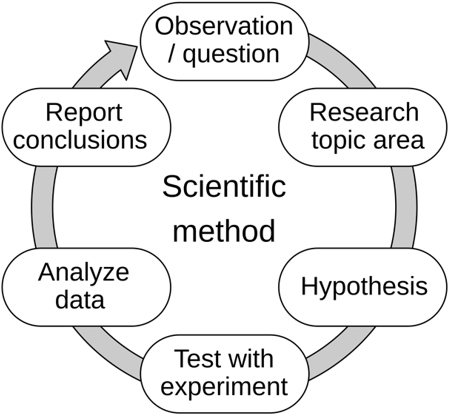
Let’s break down each step:
- Observation & question: Scientists observe something in nature that puzzles them. They develop a question about this topic that needs answering.
- Research the topic area: Scientists perform in-depth research into what other scientists have discovered about this topic. Some scientists find their answer, while others must continue with the scientific method.
- Develop a hypothesis: Observation and research lead to a hypothesis — a prediction that scientists can test with an experiment.
- Test with an experiment: An experiment, whether simple or complex, provides important data for scientists to record.
- Analyze data: After the experiment is over, scientists analyze their collected data.
- Report conclusions: A report, such as an article in a scientific journal, discusses the hypothesis, test, and data. The conclusion section states whether the hypothesis was correct.
Evaluating an Experiment’s Design
Experiments are complicated things, and scientists often spend days, weeks, or months designing them. They take three things into account when designing an experiment:
- Confounding variables: Variables outside a scientist’s control, such as the weather on a particular day, that can impact the results of the experiment.
- Independent variables:What scientists can control during the experiment, such as how much food to feed an animal or how much of a substance to add to a chemical reaction.
- Dependent variables: The results when scientists change the independent variables in an experiment. The dependent variable is the measurement or data the scientist is looking for.
For example, if a scientist wanted to know the impact of sandy soil on plant health, they could change the amount of sand in different pots of soil (independent variable) and measure the plants’ rates of growth over time (dependent variable). Other factors can impact plant growth, however, such as the amount of light or water each plant gets (confounding variables).
Experiments must also contain control groups. These are groups that do not have anything change about them and act as a constant or baseline. Control groups determine whether changing the independent variable has an effect on the subject(s), or if a confounding variable may be influencing the experiment.
Drug trials always use control groups — people told they are taking an experimental drug for their condition but actually are taking a placebo (e.g. a sugar pill). In many cases, people’s belief they are taking an effective drug is a confounding variable that produces a positive reaction, such as a temporary relief from pain. Scientists take this data into account when determining a drug’s effectiveness.
Drawing Conclusions from Scientific Data
Some HiSET science questions ask you whether evidence (e.g. a chart or graph) supports or refutes a scientific theory. These questions may also ask you to identify a trend in the data or make a prediction (also known as a forecast) about what may happen next.
These questions are often time consuming, as they require more than simple observation to answer.
Synthesizing Information
HiSET science questions may require you to synthesize information from multiple sources, such as two or more charts or a combination of text and visual stimuli. Answering these questions correctly involves a two-step process:
- Identify the central idea or hypothesis
- Focus on what the text states directly
Synthesis also relates to other scientific skills this section covers, such as drawing conclusions. Don’t forget that the HiSET science test, at its heart, is a reading comprehension test that assesses your analytical skills rather than content knowledge.
Evaluating Source Credibility
When you hear “credible sources,” you may think of what you learned in your high school English or social studies classes. Scientists also follow these same rules.
Credible sources are those whose conclusions are based on facts rather than opinions. These facts are from experts or experimental data — particularly from a well-designed experiment and has been peer-reviewed. This means that they offer an objective point of view.
Questions asking you to evaluate a source’s credibility may require you to identify an argument’s flaws. For example, a scientist writing a paper about why bee populations are declining may cite two sources to support their hypothesis — an experienced bee biologist and an amateur beekeeper. Although the beekeeper is knowledgeable in some things, they are not a credible source because they may raise only one bee hive and do not possess an academic background in bee biology.
Applying Scientific Information
On the HiSET Science test, you’ll often need to interpret and apply information from various sources like graphs, tables, and written passages. This involves understanding data, identifying relationships, and drawing conclusions based on evidence.
Key strategies for these questions include:
-
Identifying relationships: Look for how variables interact. For example, if one value increases while another decreases, there’s a negative correlation. Recognizing these patterns helps you understand what the data is telling you.
-
Linking text and data: Connect information from written passages to visual sources like graphs or tables. Often, one supports or explains the other.
-
Comparing and contrasting: When you are given multiple data sets or scenarios, compare them side-by-side. What’s similar? What’s different? This helps clarify trends and exceptions.
-
Applying concepts to new situations: Use your understanding of scientific principles to predict outcomes in different scenarios. For instance, if you know that plants require sunlight for photosynthesis, you can infer that a plant kept in darkness will not thrive.
Evaluating Statistics and Probability
Did you know that preparing for the HiSET math test can also help you on the science test? It can! Some science questions on the HiSET science test cover statistics and probability. These questions are easy to identify because they ask you to manipulate or analyze numerical data, such as information presented in charts and graphs.
There are four terms you need to know:
- Mean: The mean is the average of all numbers in a data set. To find the mean, find the sum of all values and then divide by the number of values. For example, take the number set 1, 2, 3, 4, 5. The sum of these numbers is 15. 15 divided by 5 (the number of values) is 3. The mean is 3.
- Median: The median, also known as the “middle number,” is the number that is in the middle of a data set. You can find it by organizing the numbers from smallest to largest and finding the one in the middle. For example, consider the number set 1, 5, 6, 2, 7, 3, 4. Organized, the number set is 1, 2, 3, 4, 5, 6, 7. The median is 4 because it falls right in the middle.
- Mode: The mode is the number in a data set that shows up the most (also known as the most common value). Consider the data set 1, 4, 5, 6, 2, 1, 4, 4. The mode is 4 because it shows up three times.
- Range: The range is the difference between the smallest and greatest values in a data set. In the data set of 1, 3, 6, 9, 3, 5, 2, 1, the smallest value is 1 and the largest value is 9. The difference between 9 and 1 is 8. Therefore, the range is 8.