HiSET Math Study Guide: Data Analysis, Probability, Statistics
Questions in this section will assess your ability to:
- Interpret and represent data using graphs, tables, and summaries
- Calculate probabilities of compound events using various methods
- Develop probability models to estimate event likelihoods
- Use measures of center to analyze and compare data sets
- Generalize population information from sample data using statistics
What is Probability?
Probability is a measure of how likely an event is to happen. It is expressed as a number between $0$ (impossible) and $1$ (certain). The higher the probability, the more likely the event will occur.
Approximating Probability
To estimate the probability of an event, use this formula:
$\text{Probability} = \dfrac{\text{Number of times the event occurs}}{\text{Total number of trials}}$
For example, if you flip a coin 100 times and it lands on heads 55 times, the approximate probability of flipping heads is:
$\dfrac{55}{100} = 0.55 \text{ (or 55%)}$
Developing a Probability Model
A probability model is a way to organize probabilities for different outcomes of a chance event.
- List all possible outcomes.
Rolling a six-sided die has six outcomes: $1, 2, 3, 4, 5, 6$. - Assign probabilities to each outcome.
If the die is fair, each number has an equal probability:
$P(1) = P(2) = P(3) = P(4) = P(5) = P(6) = \dfrac{1}{6}$
- Check that all probabilities add up to $1$.
$\dfrac{1}{6} + \dfrac{1}{6} + \dfrac{1}{6} + \dfrac{1}{6} + \dfrac{1}{6} + \dfrac{1}{6} = \dfrac{6}{6} = 1$
Finding the Probability of an Event
An event is a specific outcome or a group of outcomes.
- Example 1: What is the probability of rolling an even number $(2, 4,$ or $6)$?
- There are $3$ favorable outcomes out of $6$ total.
- $P(\text{even number}) = \dfrac{3}{6} = \dfrac{1}{2} = 0.5 \ (\text{or } 50\%)$
- Example 2: If you draw a card from a standard deck of $52$ cards, what is the probability of drawing a heart?
- There are $13$ hearts in the deck.
- $P(\text{heart}) = \dfrac{13}{52} = \dfrac{1}{4} = 0.25 \text{ (or 25%)}$
Hint
Common scenarios you will encounter in probability questions include rolling dice, drawing cards from a deck, and picking colored objects from baskets or boxes.
Probability of Compound Events
A compound event is when multiple events take place at the same time (or sequentially). There are two types:
- Independent events: One event does not affect the other (e.g. flipping a coin and rolling a die).
- Dependent events: One event affects the probability of the other (e.g. drawing two cards from a deck without replacement).
Methods to Find the Probability of Compound Events
1. Tables (two-way tables)
A two-way table helps organize data when two different events occur. It allows us to find probabilities by counting favorable outcomes.
Example:
A school surveyed students on whether or not they like math and science.
| Like Math | Don’t Like Math | Total | |
|---|---|---|---|
| Like Science | 20 | 10 | 30 |
| Don’t Like Science | 15 | 5 | 20 |
| Total | 35 | 15 | 50 |
Find the probability that a student picked at random likes both math and science.
- Favorable outcomes $= 20$
- Total students $= 50$
- Probability = $\dfrac{20}{50} = 0.4 \ (\text{or 40%})$
2. Lists (systematic listing of outcomes)
A list helps when there are only a few possible outcomes.
Example:
Rolling a die and flipping a coin.
Possible outcomes:
- $(1, H)$
- $(1, T)$
- $(2, H)$
- $(2, T)$
- $(3, H)$
- $(3, T)$
- $(4, H)$
- $(4, T)$
- $(5, H)$
- $(5, T)$
- $(6, H)$
- $(6, T)$
If we want to find the probability of rolling a $4$ and flipping heads:
- Favorable outcome: $(4, H)$
- Total outcomes: $12$
- Probability: $\frac{1}{12} ≈ 8.3\%$
3. Tree Diagrams
A tree diagram shows all possible outcomes in a visual way.
Example:
Tossing a coin twice.
Each branch represents an outcome:
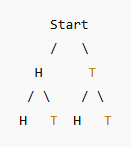
Possible outcomes: $HH, HT, TH, TT$
Probability of getting two heads $(HH)$:
- Favorable outcomes $= 1$
- Total outcomes $= 4$
- Probability $= \frac{1}{4} = 25\%$
What is the Mean?
The mean, or average, is a way to find the central value of a set of numbers. It helps summarize a data set and allows us to compare different groups.
To calculate the mean:
- Add up all the numbers in the data set.
- Divide by the total number of values in the set.
Example:
Find the mean of the following data set.
$4, 7, 10, 5, 9$
Step 1: Add them up:
$4 + 7 + 10 + 5 + 9 = 35$
Step 2: Divide by the number of values $(5)$:
$35 ÷ 5 = 7$
The mean is $7$.
Using the Mean to Compare Data Sets
The mean helps us compare different groups of numbers. A higher mean tells us that, on average, the values in one data set are greater than those in another.
Example:
Class A test scores: $80, 85, 90, 75, 95$
Class B test scores: $70, 75, 80, 85, 90$
Find the mean of each class:
- Class A Mean: $(80 + 85 + 90 + 75 + 95) ÷ 5 = 85$
- Class B Mean: $(70 + 75 + 80 + 85 + 90) ÷ 5 = 80$
Since Class A’s mean $(85)$ is higher than Class B’s mean $(80)$, we can state that Class A performed better on average.
Determining a Missing Value Given the Mean
Sometimes, you may know the mean and need to find a missing number in the data set.
Example:
A teacher knows that the mean of four test scores is $85$. The first three scores are $90, 80,$ and $85$. What is the missing fourth score?
Step 1: Set up the equation:
$\dfrac{90 + 80 + 85 + x}{4} = 85$
Step 2: Solve for $x$:
$\dfrac{255 + x}{4} = 85$
Multiply both sides by 4:
$255 + x = 340$
Subtract $255$ from both sides:
$x = 85$
The missing score is $85$.
Hint
The mean is sensitive to outliers (extremely high or low values). If one number is much higher or lower than the others, it can pull the mean up or down, sometimes making it misleading. In such cases, consider using the median (middle value) for a better picture of the data.
What is the Median?
The median is the middle value of a dataset when the numbers are arranged in order from smallest to largest.
To calculate the median:
- Arrange the numbers in order (from least to greatest).
- If there is an odd number of values, the middle number is the median. If there is an even number of values, the average of the two middle numbers is the median.
Example 1:
Find the median of the following numbers:
$3, 7, 1, 4, 9$
Step 1: Arrange the numbers in order:
$1, 3, 4, 7, 9$
Step 2: The middle value is $4$.
The median is $4$.
Example 2:
Find the median of the following data set.
$8, 2, 5, 1, 2, 3$
Step 1: Arrange the numbers in order:
$1, 2, 2, 3, 5, 8$
Step 2: Find the average of the two middle numbers (2 and 3):
$\dfrac{2 + 3}{2} = \dfrac{5}{2} = 2.5$
The median is $2.5$.
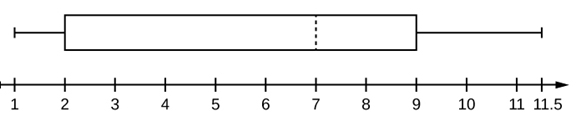
Box Plots (Box-and-Whisker Plots)
A box plot, also called a box-and-whisker plot, is a simple way to display the distribution of a dataset. It highlights five key numbers: the minimum, first quartile (Q1), median (Q2), third quartile (Q3), and maximum.
Here is a labeled box and whisker plot, showing the key parts:
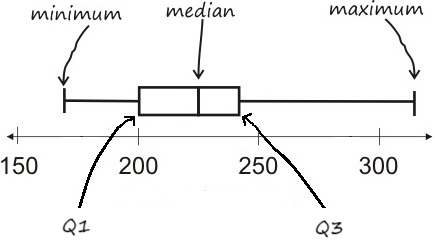
- Minimum (whisker): The lowest data point within the range.
- Q1 (first quartile): The 25th percentile, marking the lower bound of the interquartile range.
- Median: The middle value of the data set.
- Q3 (third quartile): The 75th percentile, marking the upper bound of the interquartile range.
- Maximum (whisker): The highest data point within the range.