HiSET Math Study Guide: Algebraic Concepts Part 2
Questions in this section will assess your ability to:
- Create and solve equations and inequalities
- Rearrange formulas to isolate variables
- Understand functions and function notation
- Analyze key features of functions
- Determine domain and range of functions
Creating and Solving Equations & Inequalities
Equations and inequalities are powerful tools for representing relationships in both mathematical and real-world situations. Understanding how to set up and solve these expressions is crucial for problem-solving.
Equations vs. Inequalities
- Equations contain an equal sign $(=)$, showing that two expressions are equal.
- Example: $3x + 5 = 20$
- Inequalities use symbols such as $<, >, ≤,$ or $≥$ to compare expressions.
- Example: $2y − 7 ≥ 9$
Creating and Solving Equations and Inequalities
- Identify the unknown(s): Define variables to represent unknown quantities.
- Example: You spent \$$40$ buying $4$ tickets at the movies and want to know how much a single ticket cost. You know how much you spent and how many tickets you purchased; the only unknown is the cost of a single ticket, which can be represented as $x$.
- Set up the equation or inequality: Establish relationships using the given information.
- You know the total has to equal $\$40$. We established that the price of a ticket is $x$ and the number of tickets is $4$. The number of tickets multiplied by the price of each ticket will get us the total spent. Thus, the equation is $4x = 40$.
- Isolate the variable: Use inverse operations (addition, subtraction, multiplication, or division) to solve.
- Divide both sides by $4$ to isolate $x$: $x = 10$
- If you multiply or divide by a negative number, reverse the inequality sign.
- To solve $−4x > 40$, divide each side by $-4$ and flip the sign: $x < −10$
Inequalities follow the same steps, but watch for reversing the sign:
Hint
When solving real-world problems, define variables clearly and check if an equation or inequality makes sense in context. Always interpret solutions to ensure they align with the given scenario.
Rearranging Formulas to Highlight a Quantity of Interest
In algebra, you often need to manipulate equations to solve for a specific variable. This process is called rearranging formulas and is useful in various real-world applications, from physics to finance.
Key Steps for Rearranging Formulas
- Identify the target variable: Determine which variable you need to isolate.
- Use inverse operations: Apply addition, subtraction, multiplication, and division in reverse order to move terms step by step.
- Maintain balance: Whatever operation you perform on one side of the equation, do the same on the other.
- Simplify the expression: Factor, combine like terms, or reduce fractions if necessary.
Examples
Example 1: Solving for a Variable in a Linear Equation
The formula for the perimeter of a rectangle is:
$P = 2L + 2W$
To solve for $L$:
- Subtract $2W$ from both sides:
$P − 2W = 2L$
- Divide by 2:
$L = \dfrac {P − 2W}{2}$
Example 2: Solving for Time in Distance Formula
The distance formula is:
$d = rt$
To solve for $t$:
- Divide both sides by $r$:
$t = \dfrac{d}{r}$
Example 3: Solving for a Variable in a Formula with Exponents
The formula for the area of a circle is:
$A = \pi r^2$
To solve for $r$:
- Divide both sides by $\pi$:
$\dfrac{A}{\pi} = r^2$
- Take the square root of both sides:
$r = \sqrt{\dfrac{A}{\pi}}$
Hint
When rearranging formulas, work step by step and check your final equation by substituting values to ensure it makes sense. If a variable appears in multiple terms, factor it out before isolating it.
Understanding Functions and Function Notation
A function is a relationship between two quantities in which each input (usually represented as $x$) corresponds to exactly one output (usually represented as $y$ or $f(x)$). Functions can be represented in multiple ways: as equations, tables, graphs, or verbal descriptions.
Function Notation
Instead of writing $y = 3x + 2$, we can use function notation:
$f(x) = 3x + 2$
Here, $f(x)$ represents the output when $x$ is the input. If asked to evaluate $f(4)$, substitute $x = 4$:
$f(4) = 3(4) + 2 = 14$
Key Features of Graphs and Tables
Graphs and tables provide visual representations of functions. When analyzing them, focus on the following key features:
- Intercepts: The points where the graph crosses the $x$-axis ($x$-intercept) and $y$-axis ($y$-intercept).
- Domain and range: The domain is the set of all possible input values ($x$-values), and the range is the set of all possible output values ($y$-values).
- Increasing/decreasing intervals: Identifying where the function’s values are rising or falling as $x$ increases.
- Maximum and minimum points: The highest or lowest points in the function, which may indicate important real-world constraints.
- Rate of change: The function’s steepness, often represented as the slope in linear functions.
Interpreting Function Notation in Context
Function notation is often used to describe real-world relationships. Suppose $D(t)$ represents the earnings for working $t$ hours. If given $D(5) = 200$, this means the dollars earned for $5$ hours of work is $\$200$.
Writing a Function from a Relationship
To express relationships using functions, identify how the output depends on the input. For example, if a car rental company charges a $\$50$ base fee plus $\$20$ per hour, the cost function is:
$C(t) = 50 + 20t$
This equation shows $C(t)$, the total cost, depends on $t$, the number of rental hours.
Hint
When interpreting graphs or tables, always check the scale of the axes and whether the function’s behavior aligns with real-world expectations (e.g. a negative height doesn’t make sense in most contexts).
Understanding the Domain and Range of a Function
The domain and range of a function describe the possible values of the input (independent variable) and output (dependent variable), respectively. Understanding these concepts is essential for analyzing functions in both mathematical and real-world contexts.
Domain: The Set of Possible Inputs
The domain of a function is the set of all possible input values (typically $x$-values) that make the function valid. To determine the domain, consider:
-
Mathematical Restrictions:
- A function cannot have division by zero (e.g. $f(x) = \frac{1}{x − 3}$ is undefined at $x = 3$, so $x = 3$ is excluded from the domain).
- A function cannot have an even root (like a square root) of a negative number in real numbers (e.g. $f(x)= \sqrt{x − 2}$ requires $x − 2 ≥ 0$, so the domain is $x ≥ 2)$.
-
Contextual Restrictions:
- In real-world problems, the domain is often limited by the situation. For example, if $x$ represents time, negative values likely do not make sense.
Example 1: Finding the Domain
Given the function $g(x) = \frac{5}{x – 2}$, we must exclude any $x$ that makes the denominator zero:
$x − 2 ≠ 0 ⇒ x ≠ 2$
Thus, the domain is all real numbers except $x = 2$, or, written in interval notation:
$(\infty, 2) \cup (2, \infty)$
Hint
A real number is any rational or irrational number, including fractions, decimals, and negative integers. Numbers are not real if they are neither rational nor irrational; in other words, they are impossible. This includes $\sqrt{−1}$ and $i$.
Example 2: Real-World Context
If a function models the height of a ball thrown in the air, the domain likely only includes non-negative values of time $t$, such as $0≤t≤5$ seconds.
Range: The Set of Possible Outputs
The
- For linear functions: The range is all real numbers unless there is a specific restriction.
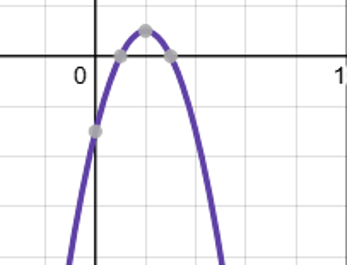
- For quadratic functions $(y= ax^2 +bx + c)$: The range depends on the vertex:
- If $a > 0$ (opens up), the range is from the vertex’s $y$-value to $\infty$.
- If $a < 0$ (opens down), the range is from $-\infty$ to the vertex's $y$-value.
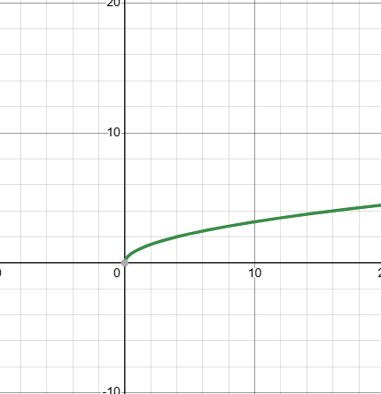
- For square root functions $(y = \sqrt{x})$: The range is always non-negative since square roots produce positive values or zero.
Example 3: Finding the Range
For the function $f(x) = x^2 − 4$, the smallest possible output occurs when $x = 0$:
$f(0) = 0^2 − 4 = −4$
Since the parabola opens upward, the range is [$-4, \infty)$.
Interpreting Domain and Range in a Real-World Setting
In applied problems, always check what values make sense in context. Consider a function $P(d)$ that models the population of a town $d$ years after the year $2000$:
- The domain might be $0 ≤ d ≤ 50$ (years from $2000$ to $2050$).
- The range might be $5,000 ≤ P(d) ≤ 25,000$, if the town’s population never drops below $5,000$ or exceeds $25,000$.
Hint
When determining domain and range, always check for mathematical restrictions (like division by zero or square roots of negatives) and real-world constraints (like time or height not being negative). When in doubt, analyze the graph or table to see which inputs and outputs actually make sense in context.


